Building a more complete record of earthquakes in the North to understand earthquake physics
Earthquakes come in many flavours: As foreshocks, mainshocks, aftershocks, as earthquake swarms, in spatial clusters, as repeating earthquakes, with different sizes and mechanisms that are linked to the physical processes involved in the sudden movement of rock in the Earth’s crust.
For seismologists, an important question is whether there is a physical connection between earthquakes. Possible mechanisms are stress transfer between faults, fluid migration, rate-and-state-dependent changes in friction, remote triggering, or anthropogenic activity.

Monitoring earthquakes since 1905
The Norwegian National Seismic Network (NNSN) is a cooperation between the University of Bergen (UiB) and Norsar, who maintain 42 distributed seismic stations (UiB) and 7 seismic arrays (Norsar) across Norway. Together with recordings from neighbouring countries, the NNSN uses these data to constantly monitor seismic activity in the region (about 8000 earthquakes a year), a routine task that started in Bergen in 1905.
"We sincerely acknowledge Sigma2 for providing access to the HPC systems and for their support, especially in rewriting code for hardware on LUMI."
Felix Halpaap, Postdoctoral Fellow & Lars Ottemöller, Professor
Cataloguing earthquakes for statistical analysis
A crucial tool for seismologists to study plate tectonics and earthquake processes are catalogues of seismic events, with assigned event parameters such as location, magnitude, time of occurrence, source mechanism, event type, parameter uncertainties, and station-specific seismic wave arrival times and amplitudes. Such catalogues are data products built from seismograms recorded at seismic stations, and they form the basis of statistical analyses for the occurrence of earthquakes.
Statistical analyses of the catalogues are the main tool to map earthquake hazards and they allow us to evaluate how earthquake studies, from the laboratory and from modeling, apply in the real world. The best earthquake catalogues are complete even for smaller events and have more accurate solutions for the event parameters - allowing more robust and conclusive deductions through statistical analyses.
Searching decades of digital seismograms for known patterns
The NNSN researchers use template matching, a form of pattern recognition, that allows them to robustly detect weak seismic signals, even those buried in noise. Their data are 25 years of digital seismograms that have been continuously recorded across the NNSN. They search for seismogram patterns that are similar to previously catalogued earthquakes (i.e., a template).
As a metric of similarity, the researchers use cross-correlation of seismogram template and continuous data, computed for a 90-s window at every data sample (20 samples per second), at 300 seismic stations with 3 channels each, for each template. They employ this search at the core of their data processing pipeline, and in one application they apply it to a dataset of 15500 templates - requiring about ~2* 10^17 cross-correlation values. Calculating these values is very efficient on GPUs, so using the Saga and LUMI clusters was crucial to make this application feasible at this scale.
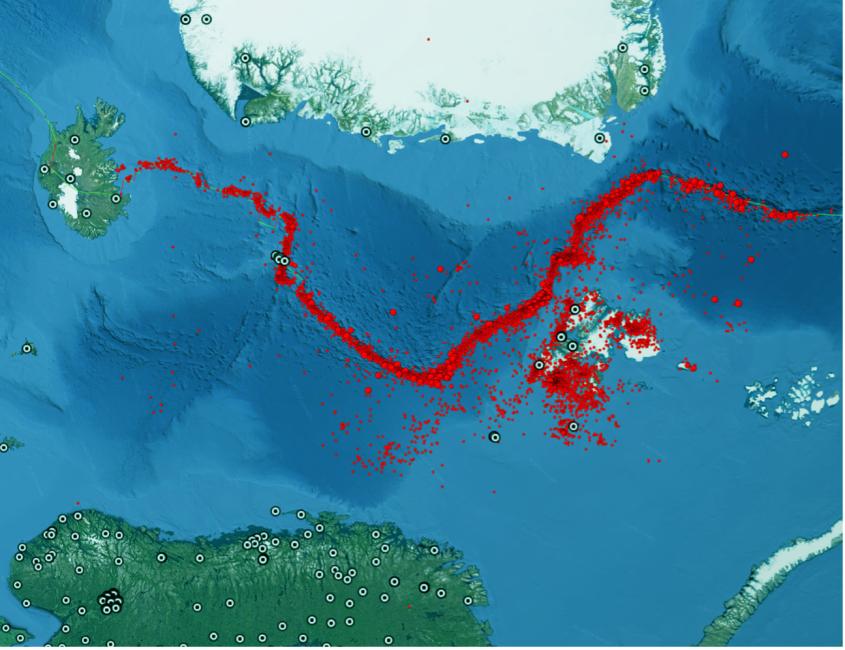
A 15-fold increase in detected earthquakes
The resulting earthquake catalogue for the region stretching from Jan Mayen to the North Pole comprises more than 400 000 earthquakes, a 15-fold increase from the previous catalogue containing 27 000 earthquakes. Depending on the region, this catalogue is complete down to a magnitude that is 1 to 1.5 units lower than previously, with event parameter uncertainties that are up to 10 times smaller. It enables the researchers to identify new earthquake sequences, study seismicity patterns, and recognize spatial and temporal changes in seismic activity. This, in turn, helps understand the physical processes governing the interactions of earthquakes in the region.